
software resources for science and technology education


MORE INFO

Insight iLOG VideoLab -
|
●
|
DATA-
|
|
●
|
VIDEO ANALYSIS
|
|
●
|
MODELLING
|
Insight iLOG VideoLab is the latest enhancement of Insight iLOG Studio
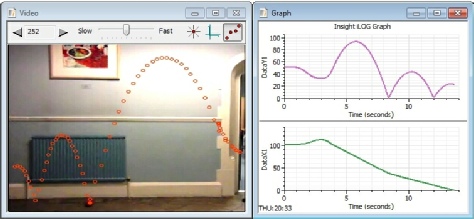
Insight iLOG programs for data-logging and modelling are unrivalled for their versatility and ease of use. Now VideoLab adds a comprehensive video analysis system which provides a new dimension for practical experiments in the study of motion.
VIDEO ANALYSIS
With Insight iLOG VideoLab you can:
|
●
|
Use a webcam or any video input device for directly recording video images of scenarios involving motion
|
|
●
|
Import, display and analyse video clips recorded with a digital camera, camcorder, telephone or downloaded from the Internet.
|
|
●
|
Use automatic tracing tools to mark frame-
|
|
●
|
Obtain measurements of distance-
|
|
●
|
Practise video analysis skills with the built-
|
By combining video analysis with data-logging and modelling, Insight iLOG VideoLab is the complete software companion for practical science.
DATA-LOGGING
Intelligent interface selection and sensor checking
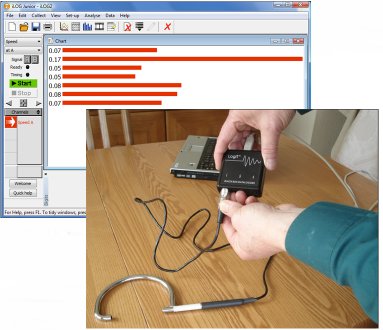
Insight iLOG works with an expanded range of manufacturers’ interfaces, loggers and sensors and incorporates new driver software. The intelligent recognition facility provides automatic identification of the type of logger and connection port in use. Thumbnail images give visual confirmation of the logger type and the connected sensors. A test button on the Control panel facilitates a quick check that sensors are working.
Data logging modes
In addition to the usual range of logging modes (real-time, snapshot, remote, timing and motion, manual entry), three additional modes are special features:
Virtual logging simulates logging, but draws data from a source in the user’s computer or network
Online logging simulates logging, but draws data from a source on the Internet
Scope logging offers fast data collection with a timebase that simulates the functions of an oscilloscope.
Wave generator and spectrum analysis
A sound wave generator produces sine, square or triangular waves through the computer's sound system. A spectrum analyser shows the harmonic content of the wave output or of waves captured using Scope logging.
MODELLING
Modelling system
The unique Insight modelling system is a versatile mathematical tool for simulating a wide variety of physical phenomena. Data generated by models may be compared directly with experimental data from data-logging and with motion data from video analysis.
Welcome wizard
This facility configures the program quickly for the most common uses. There are step-by-step instructions, useful for new users, as well as quick set-ups required by more familiar users.
It gives ready access to:
|
●
|
A variety of logging modes for collecting data from sensors
|
|
●
|
A system for capturing and analysing videos of experiments involving motion
|
|
●
|
A built-
|
|
●
|
Libraries of data files and online resources
|
|
●
|
Demonstration videos
|
|
●
|
Interactive information about the connected interface and sensors
|
|
●
|
A modelling system, unique to Insight programs
|
Demonstration viewlets
This series of short videos with audio commentaries demonstrates how to perform a range of data collection activities with the program.
Quick help
This is a quick-reference guide on how to use the main tools in the program for making observations and analysing collected data.
Notes window
As well as allowing users to write notes and comments on the data, this has many new features facilitating the presentation of on-screen worksheets and instructions for data-logging activities. The new format allows the inclusion of images, movies and online resources.
Graph window
The presentation of data in the graph window is the major method of observing results. The new graph window offers several enhanced methods of adjusting the graph appearance:
A choice of showing sets of data in separate graphs or all combined in one graph
Quick access menus for selecting graph axes
Auto zoom and auto scale options for making data show up clearly, during or after logging
Stretch and squeeze actions for altering axes scales
Key window for identifying data and adjusting their appearance
Library of Set-up, Data and Model files
The extensive library of iLOG files is available by thumbnail selection for easy recognition. Files provide a valuable resource of exemplar activities with the program useful for demonstration, for practice or for pupil group work. All set-up files contain on-screen instructions for the activity in attractive layouts.
Enhanced user interface
Building on successful experience with their Insight data-logging predecessors, Insight iLOG programs incorporate numerous minor improvements which have a major impact on user friendliness. There are significant improvements in the performance of the toolbars, Chart window, Large digits window, Input sensors selection, Timespan selection, status messages, progress indicator and keyboard short-cuts.


DATA-
© 2021 Insight Resources